What the October 2026 numbers mean if you’re thinking of selling
Thinking about selling? Start here
If you’re planning a move in the next year, the county headline isn’t what decides your sale. Your neighborhood and your price point are. Here’s what the October numbers from our MLS show, and how we read them for sellers.
Want to know what this means for your street? Call or text us at 321-483-0210 and we’ll walk you through the numbers for your neighborhood and price point.
The October 2026 snapshot: Brevard County
These numbers come straight from the Space Coast MLS (Flexmls) Market Summary for October 2026, residential (single-family and condo combined), compared with October 2025.
| Brevard County, residential | Oct 2026 | Oct 2025 | Change |
|---|---|---|---|
| Active listings | 4,005 | 4,669 | -14.2% |
| New listings | 1,163 | 1,342 | -13.3% |
| Pending sales | 526 | 971 | -45.8% |
| Closed sales | 734 | 934 | -21.4% |
| Months of supply (absorption rate) | 4.16 | 4.99 | -16.63% |
| Average days on market (CDOM) | 78 | 95 | -17.89% |
| Median sale price | $351,200 | $342,700 | +2.48% |
| Median list price (active listings) | $360,000 | $364,500 | -1.23% |
In October, Brevard homes sold for 97.3% of their final list price, but 94.1% of their original list price.
Source: Space Coast MLS (Flexmls) Market Summary, Residential, October 2026.
What we see in these numbers
1. Fewer homes are competing with yours
There were 4,005 active listings in October, down 14.2% from a year ago, and new listings were down 13.3%. Months of supply dropped from 4.99 to 4.16. Fewer homes on the market means fewer homes competing with yours for the same buyers.
2. Homes that sold, sold faster
The average home that sold in October spent 78 days on the market, down from 95 last October. We always look at the average, not the median, because the average shows you the homes that sat.
3. Fewer buyers were writing contracts
Pending sales were down 45.8% from last October, and closed sales were down 21.4%. That’s a real slowdown in activity compared with last October, and it’s why pricing matters so much right now.
4. The first price matters
Homes sold for 97.3% of their final list price, but only 94.1% of their original list price. That gap is what price reductions look like on paper. We price to where the market is going, not where it was, so your home gets its strongest attention in the first two weeks instead of after a cut.
Why the county number isn’t “your market”
Brevard isn’t one market. It’s dozens of them. Look at how differently these zip codes moved in October:
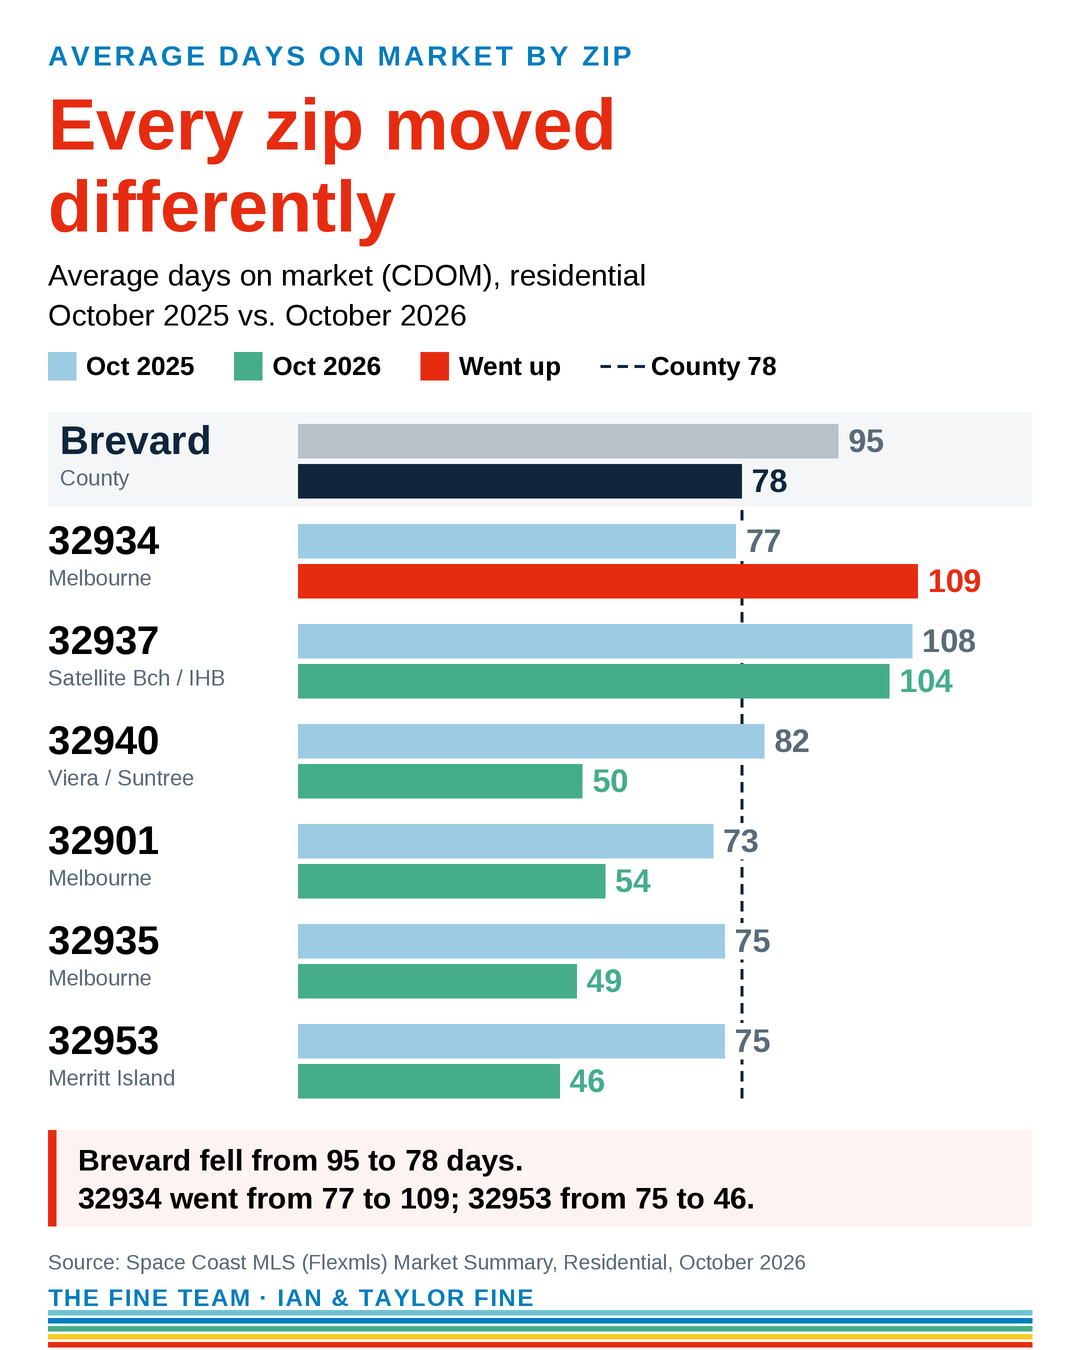
Source: Space Coast MLS (Flexmls) Market Summary, Residential, October 2026, by zip code.
A few things jump out:
- Days on market went opposite directions. In 32934, the average home took 109 days to sell, up from 77. In 32953, it was 46 days, down from 75.
- Inventory moved differently, too. Active listings in 32937 were basically flat (198 vs. 199), while 32940 had about a third fewer homes for sale than last October.
- Supply depends on where you are. Months of supply ranged from 2.88 in 32940 to 4.34 in 32937, the only one of these six zips above the county’s 4.16.
That’s why we pull the Flexmls Market Summary for each zip we work every month and look at:
- Same-subdivision sales first, then the last 2-3 years, then the homes you’d be competing against right now
- Average days on market, not the median
- Where your price lands in buyers’ search brackets (we price on round 25K brackets, never $XYZ,900)
What this means if you’re selling in the next 6-12 months
- Start with the right first price. The gap between 97.3% of final list price and 94.1% of original list price is the cost of chasing the market down.
- Know your micro-market. Your zip, your neighborhood and your price point matter more than any county headline, including this one.
- Get the home ready without overdoing it. We help you decide what’s worth fixing and what to leave alone before you spend a dime.
Online estimates can lag the market in both directions, so we look at real sales and real competition with you, in person.
Let’s talk about your home
We’re Ian and Taylor Fine, The Fine Team with LoKation Real Estate. We help Brevard homeowners sell for the highest price the market will pay, with a plan built around their neighborhood and price point.
Call or text 321-483-0210 or email office@thefineteambrevard.com, and we’ll walk you through what’s happening on your street.